Data Storytelling Workshop with David McCandless
In Partnership With:
This is a 4-hour online workshop. Limited tickets are available and are free for members. This event is in partnership with Technology Ireland Digital Skillnet and therefore attendees are required to submit additional information on booking for general statistical purposes. See the privacy statement here.
Enhance your data storytelling skills to convince, convey and communicate with global data viz guru, David McCandless.
If you want to convince, convey or communicate with business stakeholders using data as evidence, you better have more than a table of numbers ready.
Today, your narrative or how you tell a compelling, persuasive and memorable story based on your data is one of the hottest skills for analytics professionals, data workers and technology experts. It’s part art and part science.
We know that developing your data storytelling and data visualisation skills will enhance your career and dramatically improve interactions with business stakeholders and the c-suite.
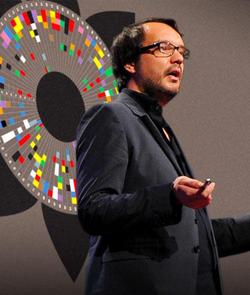
Workshop instructor, David McCandless, literally wrote the book (actually books) on data visualisation and telling a data-based story through visual cues that structure a narrative for better decision making. Globally, David McCandless and his “information is beautiful” approach has gained a cult following from data analysts, data scientists – in fact, any kind of data worker wanting to communicate insights for comprehension, clarity and conciseness.
Workshop outline:
Creating impactful infographics & data-driven stories the information is a beautiful way.
How do you create effective, interesting, impactful, and, above all, useful data-visualisations, charts, and infographics?
How do you combine visual thinking, statistical rigour & organisational goals without compromise?
Best-selling author and data-designer, David McCandless of Information are Beautiful, will share his process, tricks, and techniques for communicating ideas and telling stories with data.
In this fun 4-hour workshop, you will directly learn:
-
concepting techniques for the generation of solid, interesting ideas ripe for visualization
-
several methods for creating, selecting & executing of appropriate & effective charts
-
the best current tools alongside optimal choices & practices
-
how to stage and present effective data-driven stories using design & journalistic techniques
About David McCandless:
David McCandless is a prominent data journalist, information designer, and author known for his captivating visualizations that transform complex datasets into accessible and engaging narratives. His work has been featured in leading publications and has garnered widespread acclaim for its innovative approach to data visualization. He book ‘Information is beautiful’ is a favourite among our members.
FAQ's
Is there a fee to attend?
No, the workshop is free to attend for all Analytics Institute members.
When does the workshop take place?
The workshop will be delivered online via Zoom Webinars platform on April 25th from 9.30am-1.30pm. It is a 4-hour workshop and breakout rooms will be used. Once booked, the zoom access link can be found in your account and event bookings.
Who is the Workshop for?
Anyone who works with data and wants to use data-based arguments to communicate, convince or inform others, especially business stakeholders. Those working in analytics, data science, data engineering, technology, martech, finance, and technical roles will gain the skills to select the appropriate conceptual approach for visualisation, which charts are most effective, and how to blend journalistic techniques to enhance your data-driven story.
Is this an entry-level or advanced course?
The workshop is appropriate for early career professionals to learn the best approaches and techniques but is equally valuable for mid-career professionals who want to extend visualisation approaches to more concisely tell their desired story.
What special tools do I need?
You don’t need any special software to participate in this course. Much of the concepting and idea generation sections of the workshop just need paper and pen (and an open mind).
Do I need to know design?
No, you don’t need to be a designer. The beauty of data viz is in its ability to tell the desired story as succinctly as possible which requires clarity of thinking rather than ‘design’ skills. In fact, David has never studied design.
Do I need to know how to code?
No, you don’t need to know programming. This workshop is will help you learn how to tell the data story based on an ‘ideal’ dataset that you may or may not have yet. Once you are clear on what the story is and how the data visualisation might look, then you’ll need to find the data. Finding the right data sources and relevant numbers might need data engineering and programming skills but won’t be covered in this workshop.